Digest 14 April 2022 — 21 April 2022
Project Events
Connext
Connext is planning to launch a token and its contributor program.
Coinbase
Coinbase launches its own NFT marketplace.
DyDx
DyDx aims to make the protocol more decentralized and launches v4.
Yeti Finance
Yeti Finance launches on Avalanche, expanding borrowing and leveraged loan strategies.
Optimism
Optimism scaling project has reported its successes for 2021 and hinted at the rollout of its own token.
Bancor
Bancor has launched a beta version of an updated protocol.
Uniswap
Uniswap is working on optimizing its contracts to reduce transaction costs.
Curve
Curve have recently partnered with anyCall to add cross-chain strategies.
Tornado Cash
Ethereum mixer Tornado Cash has blocked sanctioned wallet addresses in its interface.
1inch
1inch deployed its protocols on the Fantom blockchain.
Metamask
Browser wallet Metamask has added support for Bitcoin.
Anchor Protocol и Acala
Anchor Protocol and Acala team up to merge Terra and Polkadot systems.
USDt
USDt is being launched in the Kusama network.
Highlights of the week
Events for the coming week
Funding
- Privy raises $8M seed funding, led by Sequoia and BlueYard Capital, to help protect user data in web3.
- Mintbase raises $7.5M in Series A + $5M in grants pool to pioneer NFT utility infrastructure.
- Sandbox plans to raise $400M in a new funding round.
Metrics
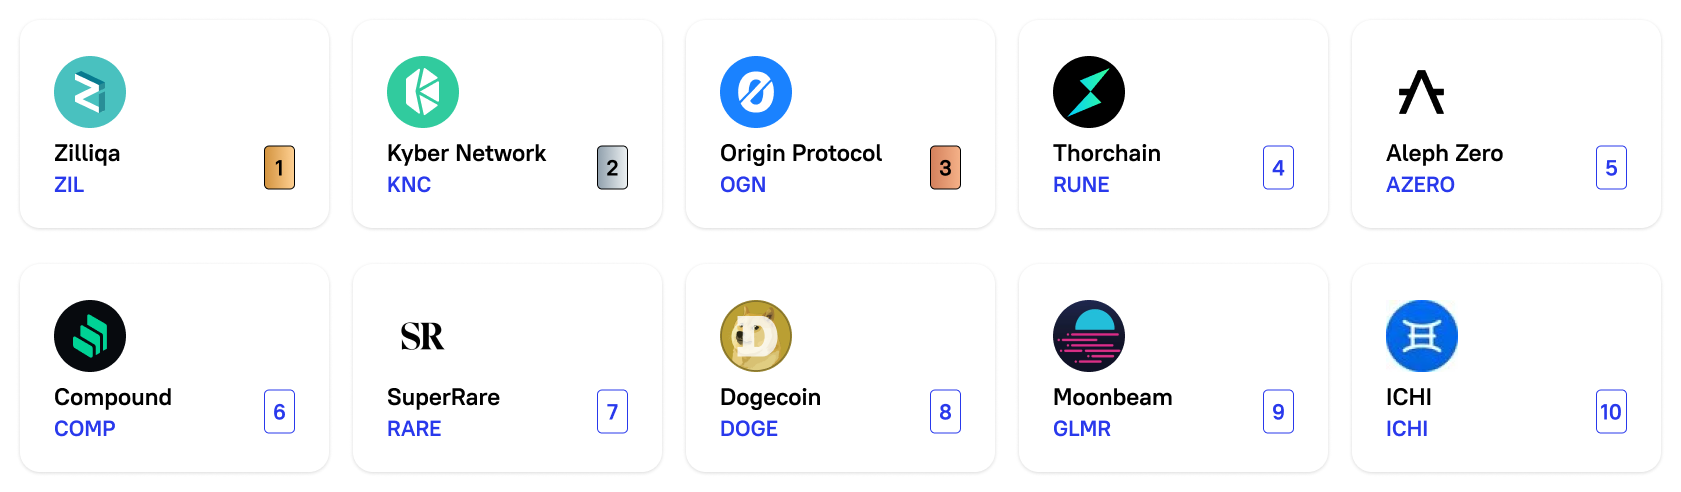
10 effective coins of the week
Assessment combines altcoin price performance relative to bitcoin and social performance.
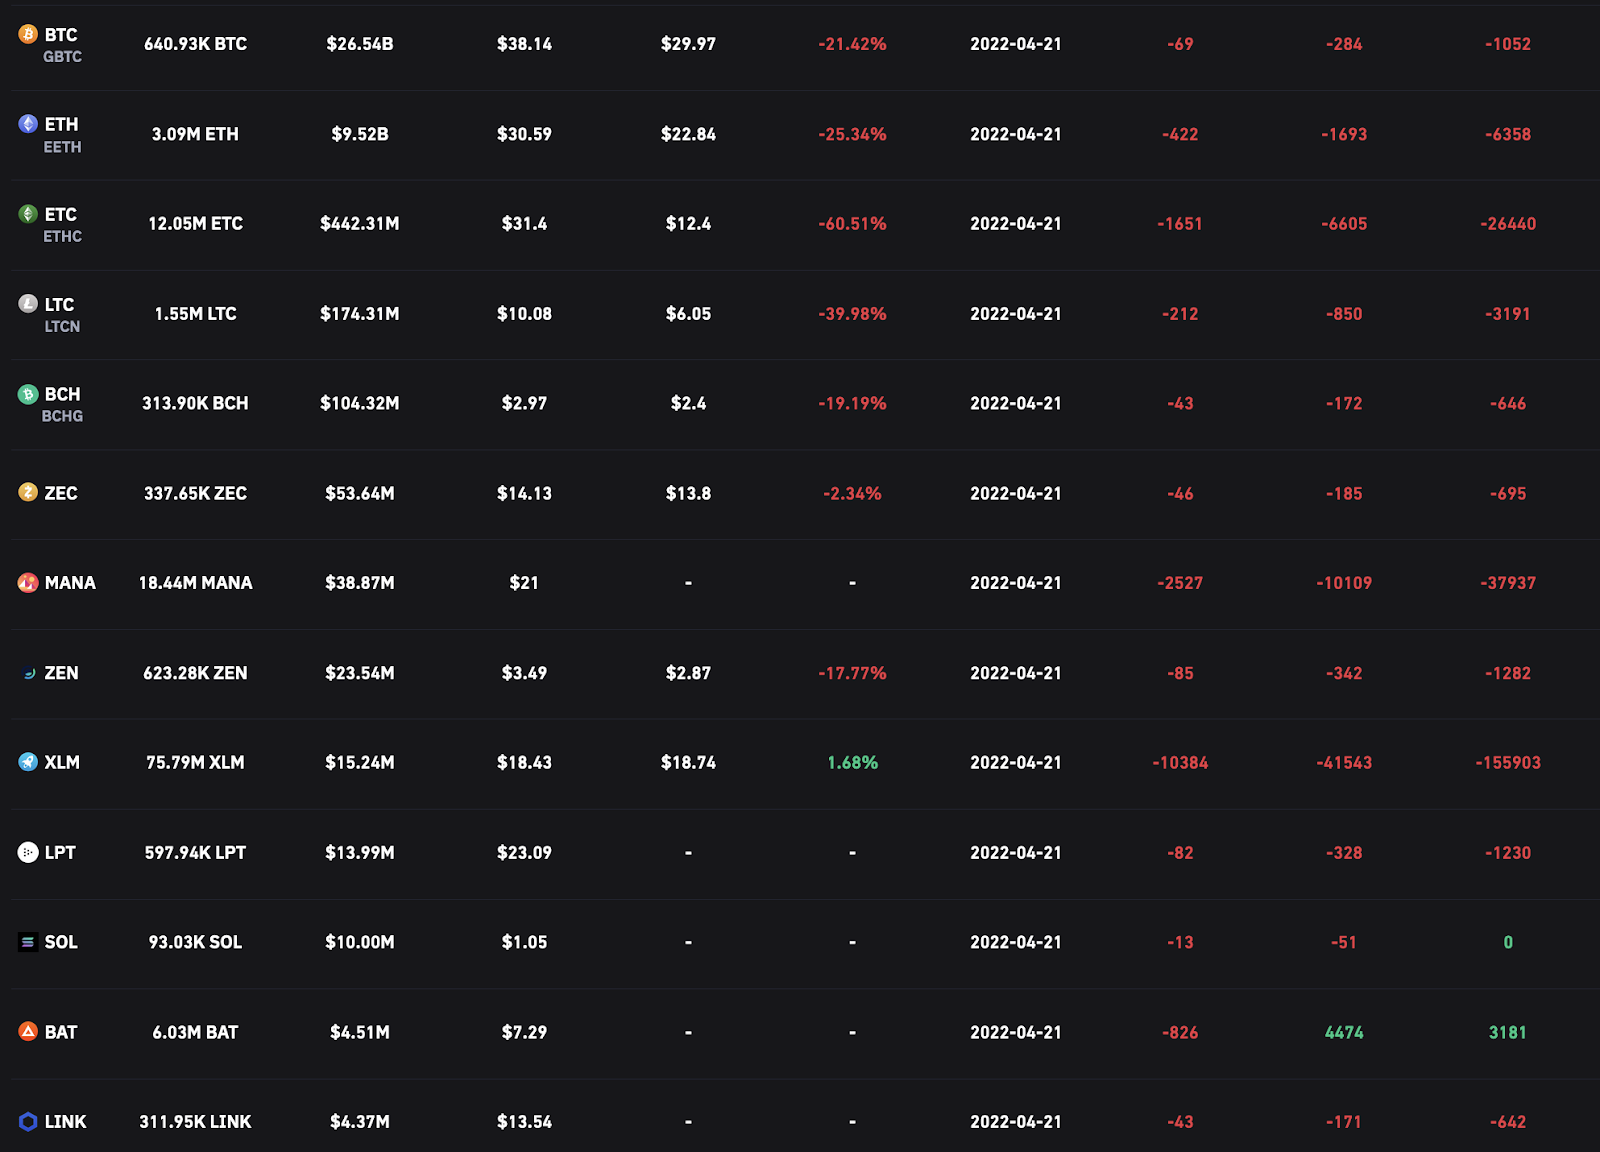
Grayscale fund portfolio dynamics
Bitcoin metrics
- Stock to flow
This model views Bitcoin as a commodity comparable to those like gold, silver, or platinum. These commodities are known as "stored value commodities" because they retain their value over time due to their relative scarcity.
For commodities of value, such as gold, platinum, or silver, a high ratio indicates that they are not primarily consumed for industrial purposes. Instead, much of it is held as a cash hedge, resulting in a higher stock-to-flow ratio.
A higher ratio indicates that the commodity is becoming increasingly scarce and therefore more valuable as a store of value.
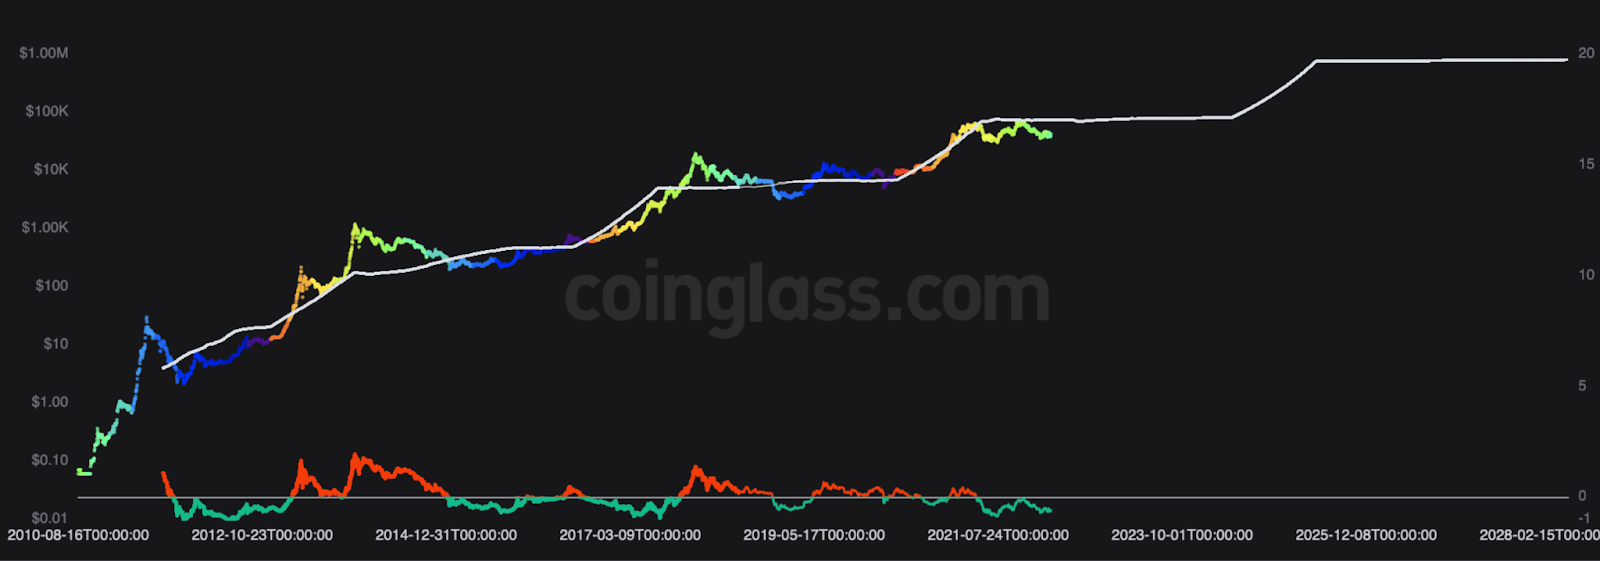
How to look at the chart?
In the above chart, the price is overlaid on top of the stock-to-flow ratio line. We can see that the price continues to follow bitcoin's stock-to-flow ratio over time. Thus, the theory suggests that we are able to predict where the price might go by observing the projected stock-to-flow ratio line, which can be calculated because we know the approximate timeline for bitcoin production in the future.
The colored dots on the price line of this chart show the number of days until the next bitcoin halving event. It's an event during which the reward for mining new blocks is halved, meaning miners get 50% less bitcoins for checking transactions.
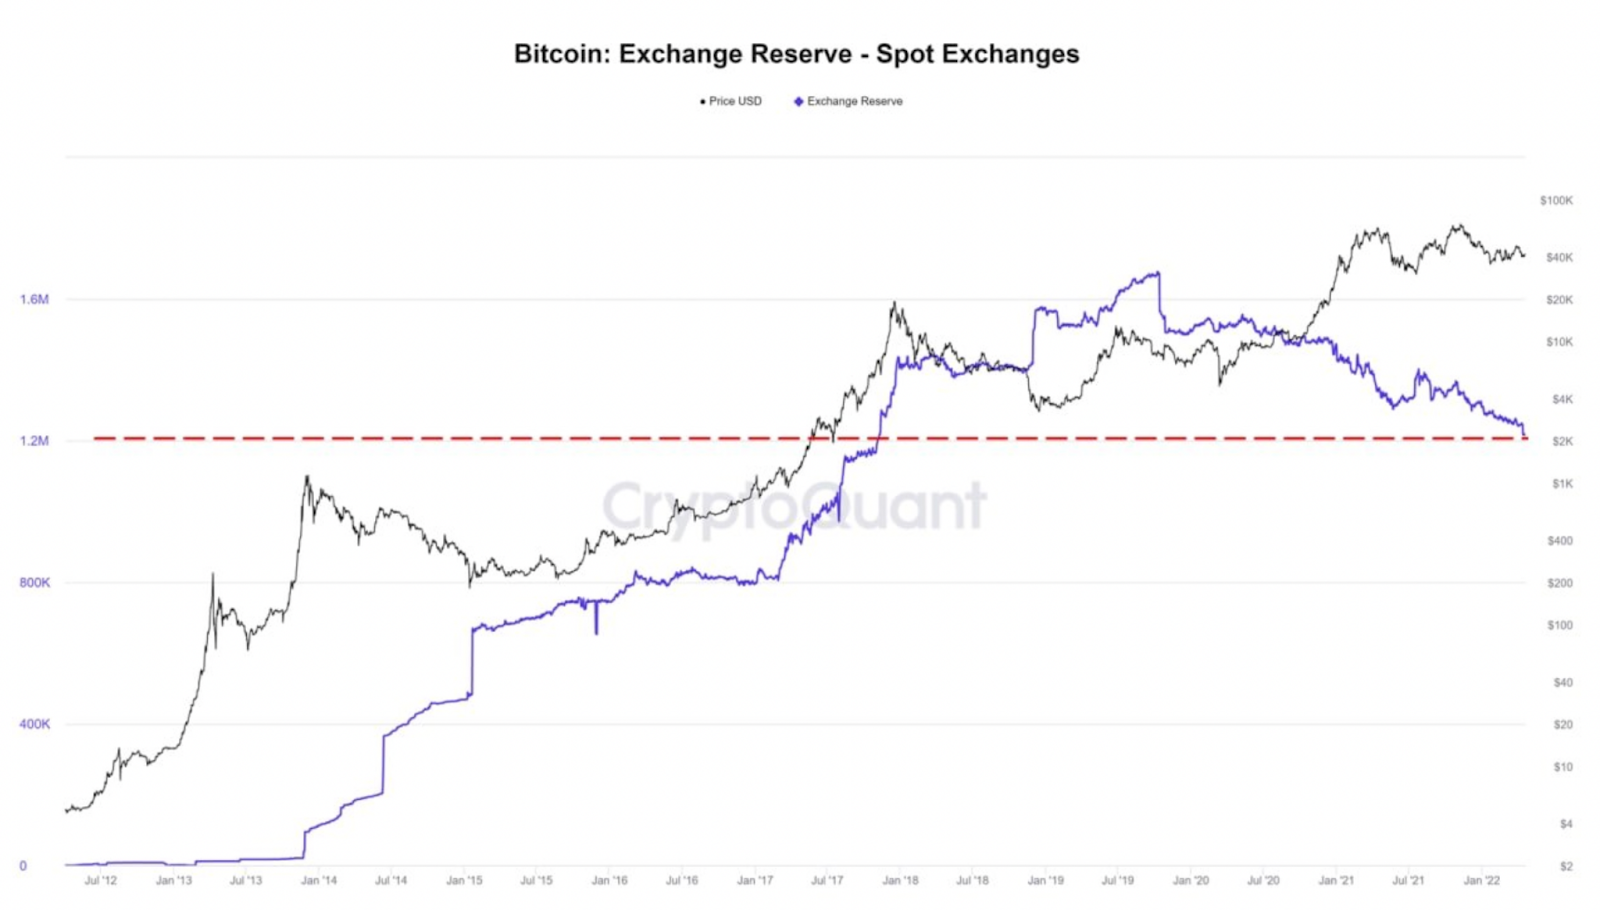
- BTC OnChain
The number of unique addresses owning at least 10,000 #BTC has formed a higher low.
Higher lows indicate bullish momentum is coming.
Whales are accumulating here.
Funding Rates
Positive funding rates imply that speculators are bullish, and long-traders pay funds to short-traders.
Negative funding rates mean that speculators are bearish, and short-traders pay funds to long-traders.
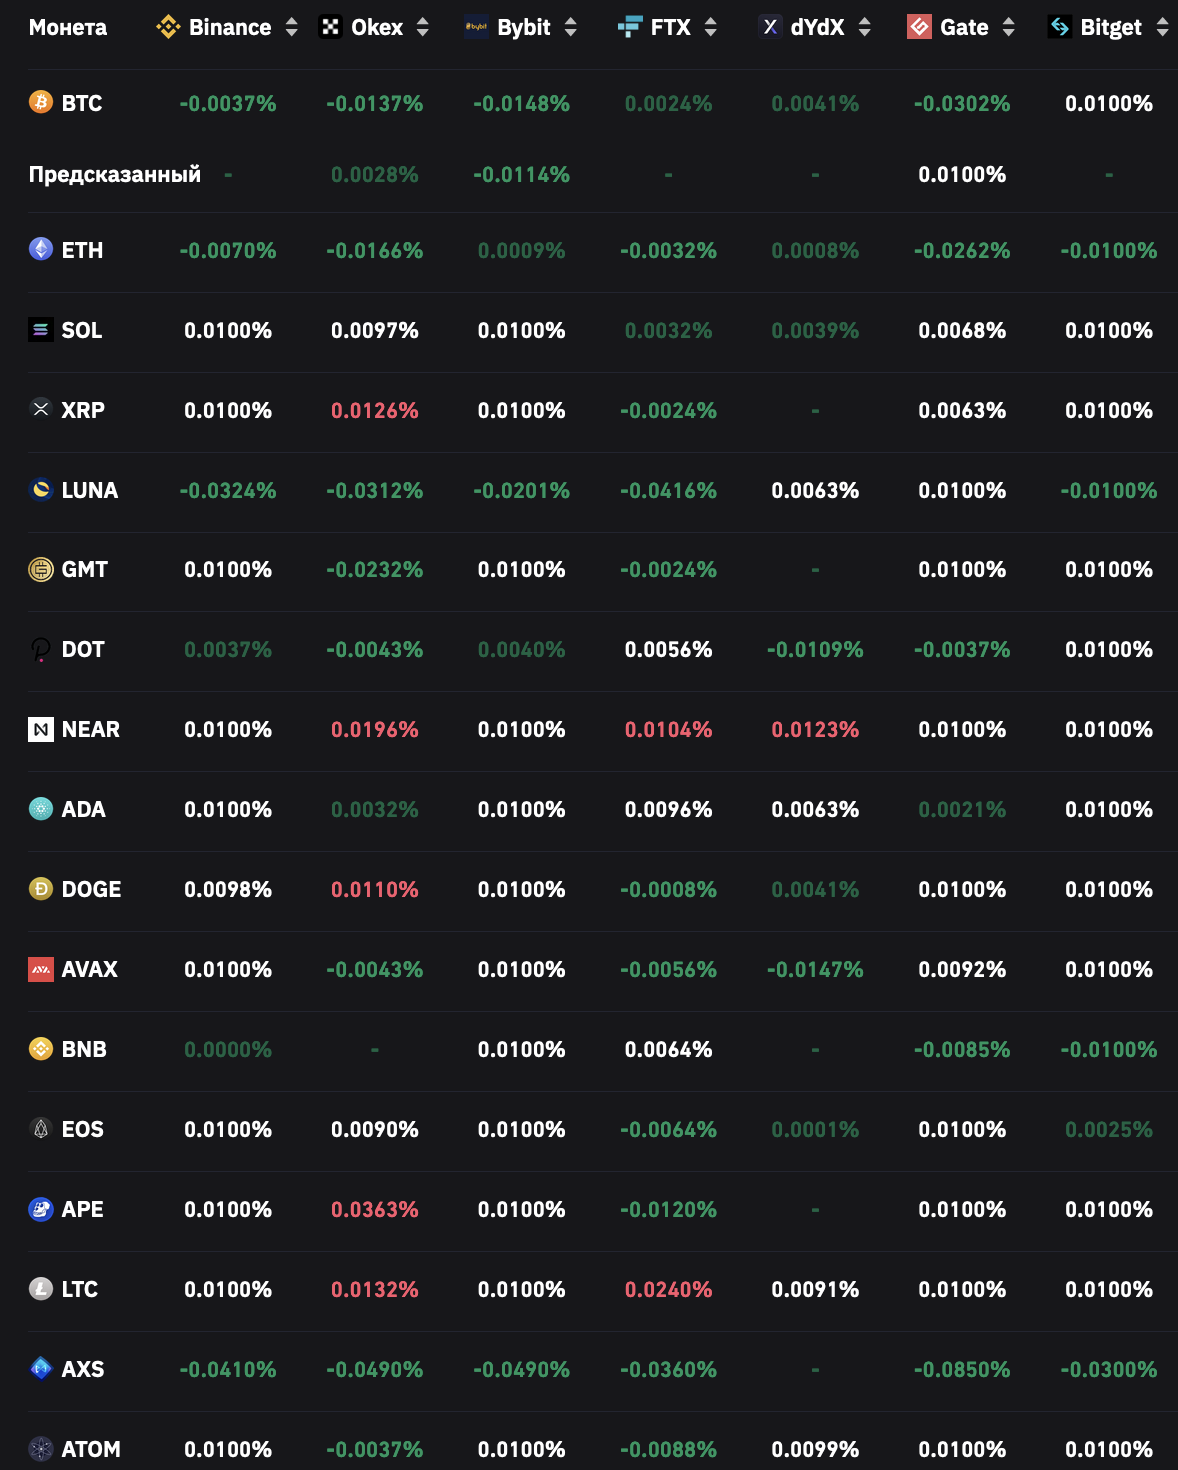
P.S. Funding rates (0.01%) - black, this is a neutral situation. Funding rates (below 0.01%) - green, this is a bullish situation. Funding rates (above 0.01%) - red, it is a bearish situation. The stronger the bearish or bullish sentiment, the darker the color.
Off chain data